| Preferred name | Taxon group | First record date | Last record date | Records | |||||||
|---|---|---|---|---|---|---|---|---|---|---|---|
| No information available | |||||||||||
Indigenous Plant Records
Controls at the top right of the map:

The 4-headed arrow control lets you navigate around the map.
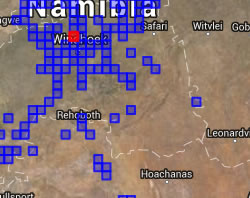
The question mark icon lets you interrogate the data - click on it and then on any data point to select it and see the corresponding record in the table below, or click and drag to select a set of data points:
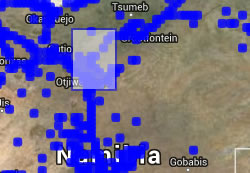
The blue plus icon allows you to switch base layers on and off, to change between a satellite image and a street map, for example:
You can also use the controls on the left of the map to navigate and zoom.
Controls on the data grid:
Click on any record in the grid to see it highlighted in red on the map:
Filter the grid and the map by typing into the red boxes in the filter row at the top of the grid. Use an asterisk as a wild card, so for example, typing *buck* in the common name box will show bushbuck, waterbuck and reedbuck. You can filter to a year by entering, for example, 2017 in the date box, or filter to a range of dates by entering, for example, 2019-2020. Press Tab or Enter to activate the filter.
Click on the right-hand icon to view a record's details:
If it is your record, and you are logged in you will also see an icon which allows you to edit the record:
Click on any column heading to sort alphabetically A-Z by that column. Click again to sort the column Z-A.
LOG IN to see the filter bar which allows you to filter the records by location, date, source, record ID etc.
If you are logged in you can use the FILTER BAR above the map to explore the records by clicking on Create a filter. Options include:
- WHERE: to fliter by location, such as quarter-degree square, monad or pentad change the drop-down list to the relevant option and type the QDS code in the 'Or, find records in map reference' box e.g. 1914 DD then click 'Apply'. NB QDS codes must be entered with capital letters. To filter by a polygon, use one of the tools at the top right of the map to draw a shape around the area you are interested in, then click 'Apply'. You may want to zoom in first. Search for records in places by typing in a name for example, Palmwag, into the search for site names box.
- WHEN: add a date range using dd/mm/yyyy format to filter by date.
- WHO: tick the box to display only your own records.
- QUALITY: you can use this to only show records with photos. Note that some of the other options (automated checks and identification difficulty) are not currently being used.
- SOURCE: use this option to restrict the species groups that are displayed e.g. only birds and snakes.
The Records tab will show the individual records, while the Species tab shows a summary for each species of the dates and numbers of records. You can save your filters for future use using the Save icon.
You can use the 'Download this report' at bottom of the data grid to download an excel file of the results.
Locations of sensitive species (rhino, pangolin) are not shown.
* Status
- C = Data entry is COMPLETE but the species identification has not been verified
- V = VERIFIED i.e. the species identification and other details have been confirmed by an expert and/or via a photograph
- R = REJECTED i.e. the record has been reviewed by an expert and has been rejected
** Certainty
- C = The observer was CERTAIN about the species identification
- L = The observer categorised the species identication as LIKELY
- U = The observer was UNCERTAIN about the species identification